Prekinder to Grade 2 Mathematics
Doing a Survey
Doing a Survey
Surveys
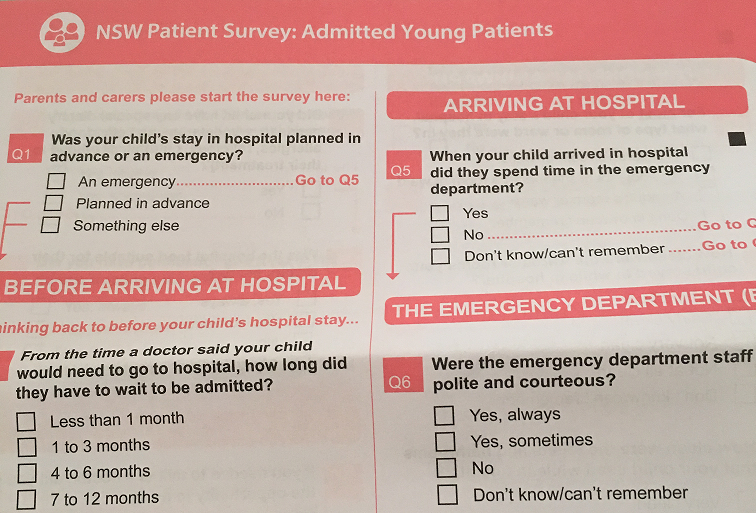
A little while ago, Christo was in hospital. It wasn't anything serious: he had a sore tummy and we needed to find out why. He is all better now. After Christo came out of hospital, he was given a survey form and was asked to fill it out.
Maybe someone has asked you to do a survey, too. Even if they haven't, the chances are that you have heard about a survey at some stage. People do surveys to find out which TV shows are most popular, which party is likely to win the next election, and which products people are likely to buy. It seems that people are doing surveys all the time.
Surveys can help us to find out about things that need to be fixed, or changed, or which make people unhappy. Governments can use surveys to find out where money needs to be spent. Christo's survey was designed to find out how things could be made better for young patients in NSW hospitals.
We can also survey things like levels of air pollution or the number of empty seats on a train service. Surveys are really very useful.
The nice thing about surveys is that you can do them yourself. They don't need to be official, or very complicated. You don't need a lot of computer equipment to do a survey. You can simply go around and ask your friends what they think about something. Surveys can answer questions about anything at all.
Conducting a Survey
If you are going to conduct a survey, you need to work out a few things first:
- Work out what you want to find out.
- Write your questions.
- Decide who you are going to ask.
- Collect your data (ask your questions).
- Put all the results together.
- Work out how you're going to display your results.
- Write a report.
What do you want to find out?
Before you start writing or asking questions, you really need to work out what it is you want to find out, and why. What are you going to use your data to do once it is collected? Answering this question will help you to decide what questions to ask.
You might only want to find out something simple, like the most popular movie that's showing at the cinema at the moment, or you might need to find out something more complicated, like which times of the day the bus from Mount Colah to Hornsby is more crowded, and why. The first one might help you to decide which movie you should go and see next. The second one might help you to decide the time at which you will catch the bus.
For example, Gus the snail has a problem with caterpillars eating all the vegetables in his garden. He has a theory that if he plants only vegetables the caterpillars don't like, then the caterpillars will go to someone else's garden and stop bothering him. To test his theory, he needs to find out which vegetables the caterpillars don't like so that he knows what to plant. So, Gus knows what he wants to find out, and how he'll use the information once he's found it out. He's ready to write the questions for his survey.
Writing the Questions
You need to make sure that the questions you write are easy to answer.
If you want to find out something that's complicated, don't write a complicated question. It might be a better idea to write two or three simpler questions.
For example, Gus might want to ask the caterpillars "What is your favourite vegetable?" or "What is the vegetable you like the least?". He only wants to find out something simple, so he only needs one simple question.
Someone who wants to know about the times of the day when the buses are crowded might need to ask a number of different questions like: "How many empty sets are there on the 9 am bus?", "How many empty seats are there on the 11 am bus", and so on. To find out why the bus is so crowded at different times, they might need to ask questions like "When do you go to work on the bus?", "When do you use the bus to go shopping?", or "Why do you catch the bus?". Complicated data needs a series of questions.
Asking Your Questions
People don't always want to answer survey questions. Sometimes they're just too busy, and sometimes they find surveys boring. When you are recording the results from your survey, make sure you record the people who don't want to answer as having given "no response".
It helps to try and make the survey a bit more interesting for your respondents (the people who are answering your questions).
Sometimes, if you can explain how the results of a survey might help your respondents, it can make them more likely to answer your questions. It might also help to come up with a creative way of asking your questions. For example, you might get people to write their answers on a piece of paper and post it in a post box that you have made and decorated.
The way you ask your questions can actually change the results of your survey. For example, only certain types of people will respond to surveys on the computer.
Deciding who to ask
There are two choices here:
- Ask everyone! This is called a
censusand may not always be possible for large groups. - Choose a small section of the population, called a
sample, to ask.

If you decide to choose a sample to ask, you need to be extra careful. Making the wrong decisions on who to ask can change the results of your survey. For example, if you want to find out what the most popular sport is, it probably isn't a good idea to choose \(100\) people from the crowd at a soccer match and ask them for their favourite sport. Many of them are likely to say "soccer".
It's best to choose your sample randomly so as to avoid bias like this in your survey results. You might choose them randomly from the telephone book, or a list like the electoral role. Maybe, you could
stand at the school gates and ask every 10th person what their favourite sport is as they come through the gates.
Bigger samples are also better than smaller samples. Hopefully, if you choose your sample carefully enough, you'll be able to use the results for your sample to make predictions about the results for the whole population.
Gus decides to do a census of the caterpillars in his garden. He's going to ask every single one of them what their favourite vegetable is.
Putting the Data Together
The first thing to do is to add up the number of each response that is given. This might involve using spreadsheets for more complicated surveys, or writing down tally marks for less complicated surveys.
Gus' survey is very simple. He's used tally marks to record his results as shown in the table below:
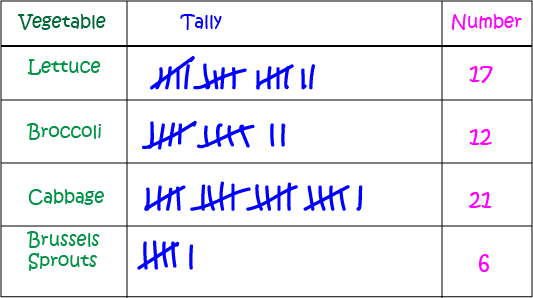
Can you see how Gus has arranged his tally marks into groups of \(5\)? He then totals up the groups of \(5\) to work out how many caterpillars have each vegetable as their favourite. To find out more about tally marks, have a look at the article on tally marks.
Displaying the Data
There are many different ways that you can display the data from a survey. The choices you make depend on how much data you have and what sort of data it is. To find out more, have a look at the article on displaying the results from a survey. For now, here's a quick summary of the different methods that are available.
Tables
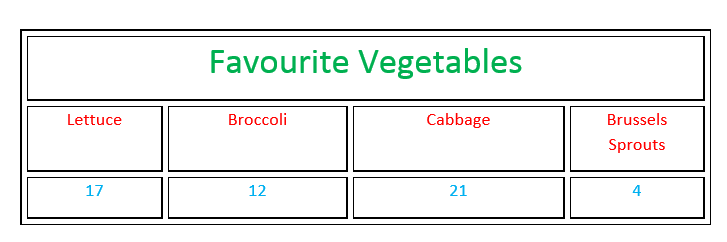
If your data isn't very complicated, you can simply report the results in a table. Tables should have titles, and each column should have a heading so that people looking at the table are able to understand what the data in the table is showing.
Here's a table of the data collected from Gus' caterpillar survey:
Statistics
Statistics like the mean, maximum and minimum values, and standard deviation can be used to give you a summary of the results from survey.
For example, if you survey the people in your class to find out how old they are, it might be more meaningful to report a summary like this, rather than a list of exact ages:
- Youngest Person: \(7\) years
- Oldest Person: \(9\) years
- Average Age: \(8.2\) years
Graphs
Graphs provide a useful way to summarise your data. They can make it easy to see the relative sizes of different categories, or they can highlight trends in your data.
Here are some of the graphs that Gus might use to display his data:
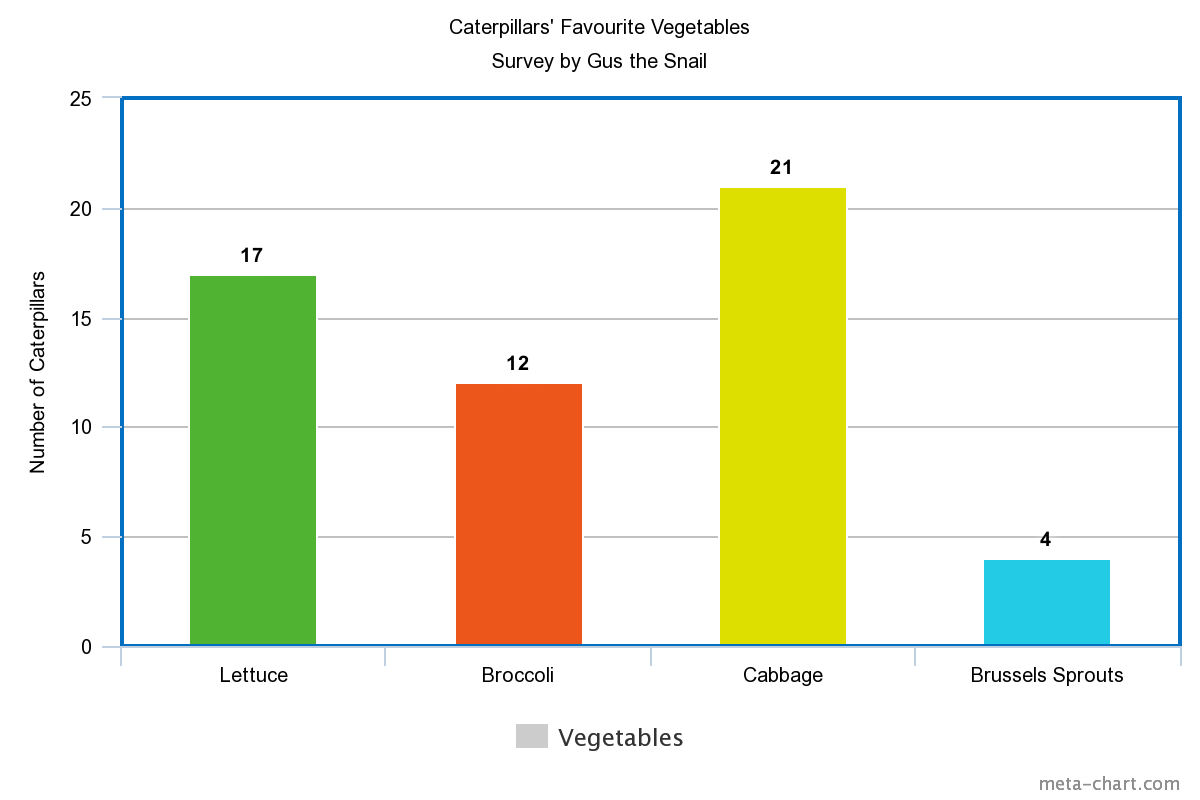
A bar chart.
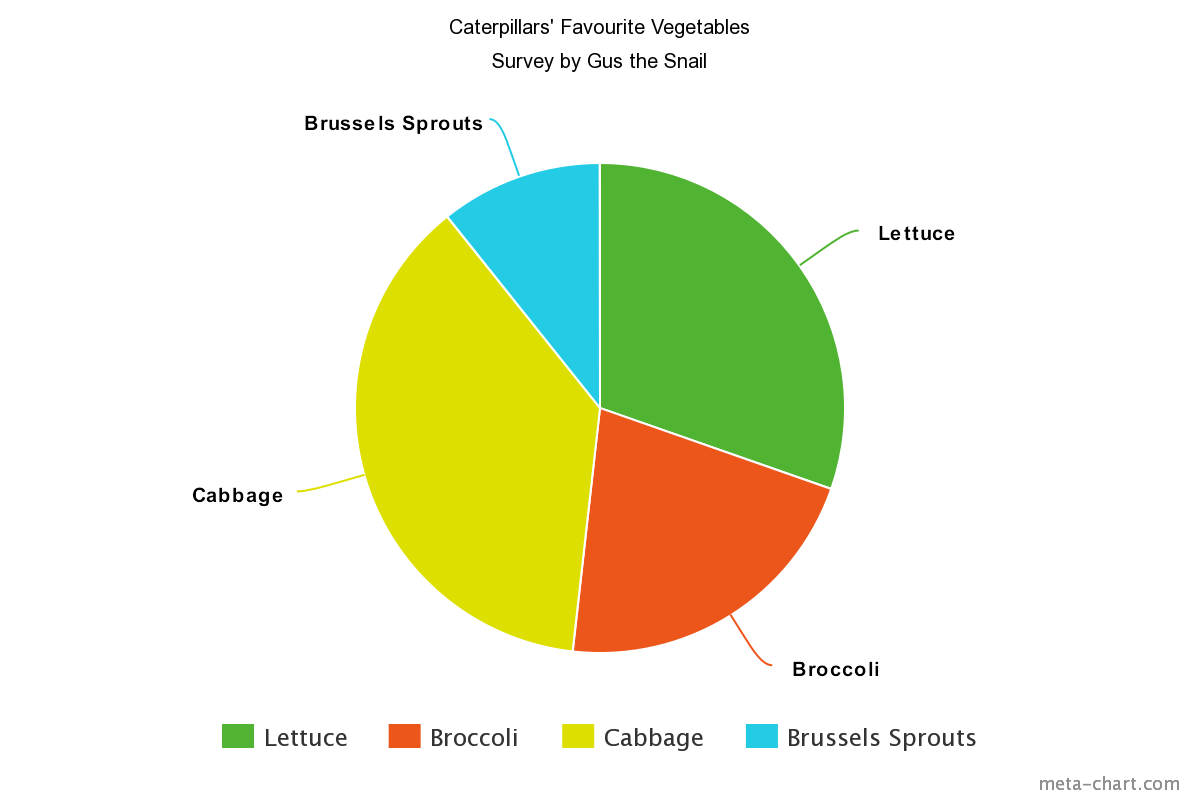
A pie chart.
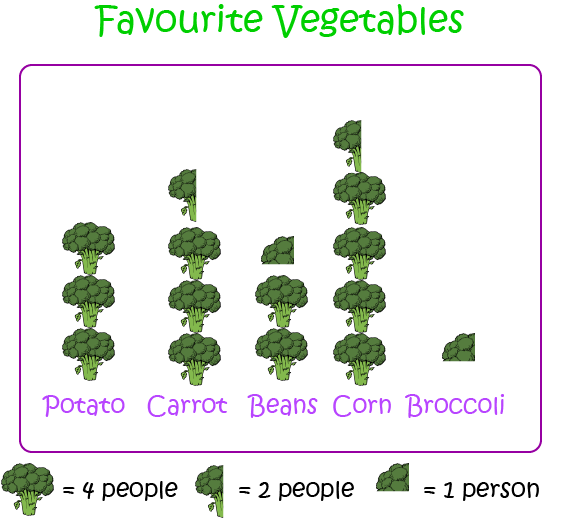
A pictograph.
To find out more about displaying data, read the articles on displaying your data, bar charts and pictographs.
Write a report
Finally, you should write a report that talks about what you have found out, any conclusions you have drawn, and what action you have taken as a result of your survey.
Conclusion
So, you see, you can do your own surveys. It doesn't involve a lot of complicated computer equipment. Just a pencil and paper are more than enough. Why don't you think of some things you would like to know and go out and do your own surveys? Have fun!
Description
This mini book covers the core of Math for Foundation, Grade 1 and Grade 2 mathematics including
- Numbers
- Addition
- Subtraction
- Division
- Algebra
- Geometry
- Data
- Estimation
- Probability/Chance
- Measurement
- Time
- Money
- and much more
This material is provided free of cost for Parent looking for some tricks for their Prekinder, Kinder, Prep, Year 1 and Year 2 children
Audience
Grade 1/Year 1, Grade 2/Year 2, Prep, Foundation, Kinder and Pre-Kinder
Learning Objectives
These lessons are for kids aged 4-8 with the core objective to expose their brains to concepts of addition, subtraction, division, algebra and much more.
Author: Subject Coach
Added on: 6th Apr 2018
You must be logged in as Student to ask a Question.
None just yet!