Prekinder to Grade 2 Mathematics
Display Your Data
Display Your Data
Survey Results

He uses tally marks to keep track of each caterpillar's response to his questions, and then totals up all the tally marks to find out which vegetables the caterpillars like best, and which they like least:
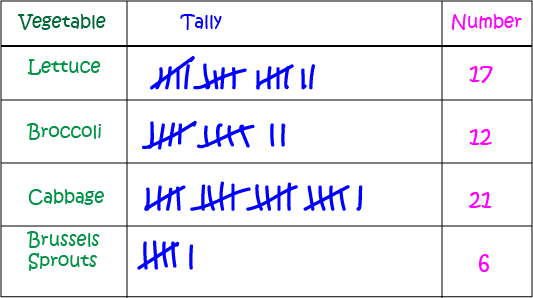
If you want to find out more about what these tally marks mean, there's an article on tally marks that should help you.
Once Gus has collected all of his data, he decides that he'd like to display it on some sort of chart so that he can easily tell which are the least and most popular vegetables. Gus has a few options to consider.
Bar Chart
Bar charts, which are also called bar graphs, provide you with a nice visual way to display data. A bar chart is made up of columns of different heights. Each column
represents data in a different category. The heights of the columns tell you how many different people or objects are in each category. Bar charts give a really quick way of telling which category is the most popular,
which category is the least popular, and which categories are more popular than which other categories. They are really useful for displaying the relative sizes of many different types of things.
Here's a bar chart displaying Gus' survey data:
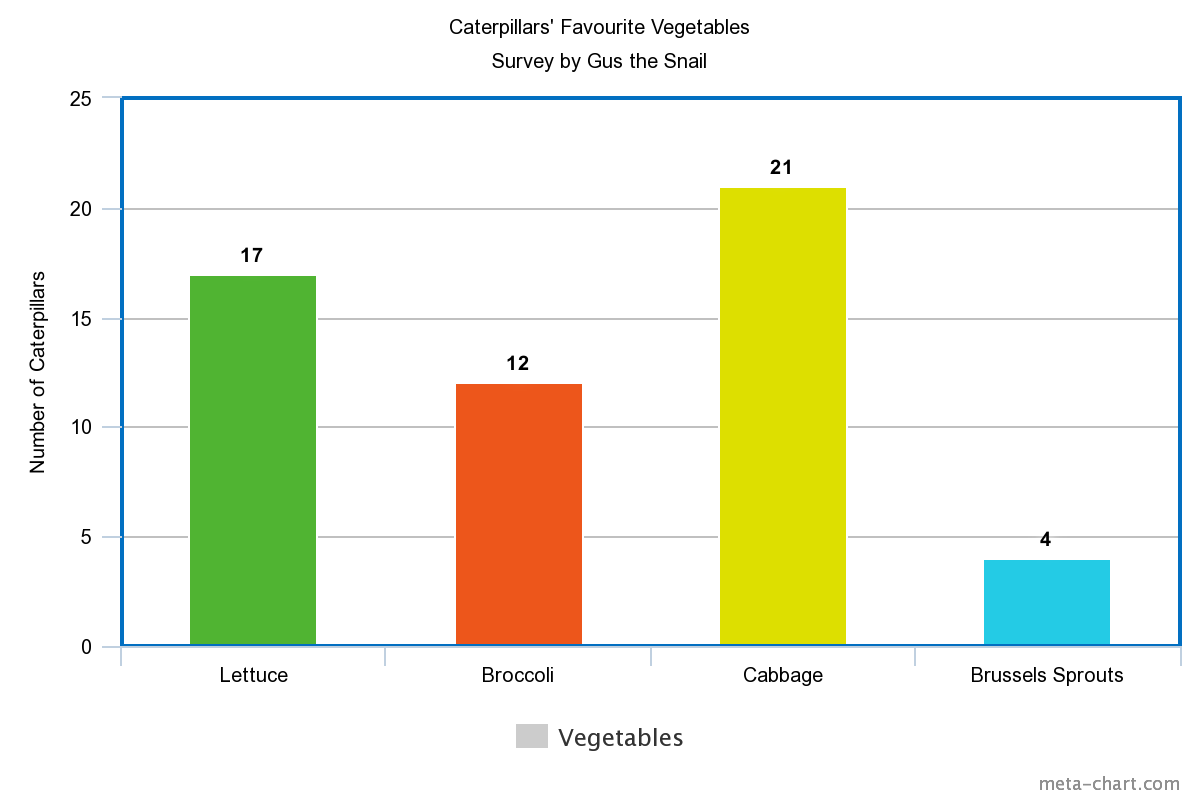
Using this bar chart, Gus can quickly see that cabbage is the most popular vegetable as it has the tallest column, and that brussels sprouts are the least popular vegetables as they have the shortest column. It looks like Gus needs to forget about cabbages and focus on planting brussels sprouts. What's that Gus, you don't actually like brussels sprouts?
Pie Charts
Another type of graph that shows the relative sizes of things is a pie chart. In a pie chart, a circle is divided up into different wedges, one for each category of data. The size of the wedge shows you how popular one category is, when compared to the other categories. If the wedge is bigger, the category is more popular. If the wedge is tiny, the category is not very popular at all.
A pie chart for Gus' survey data would look like this:
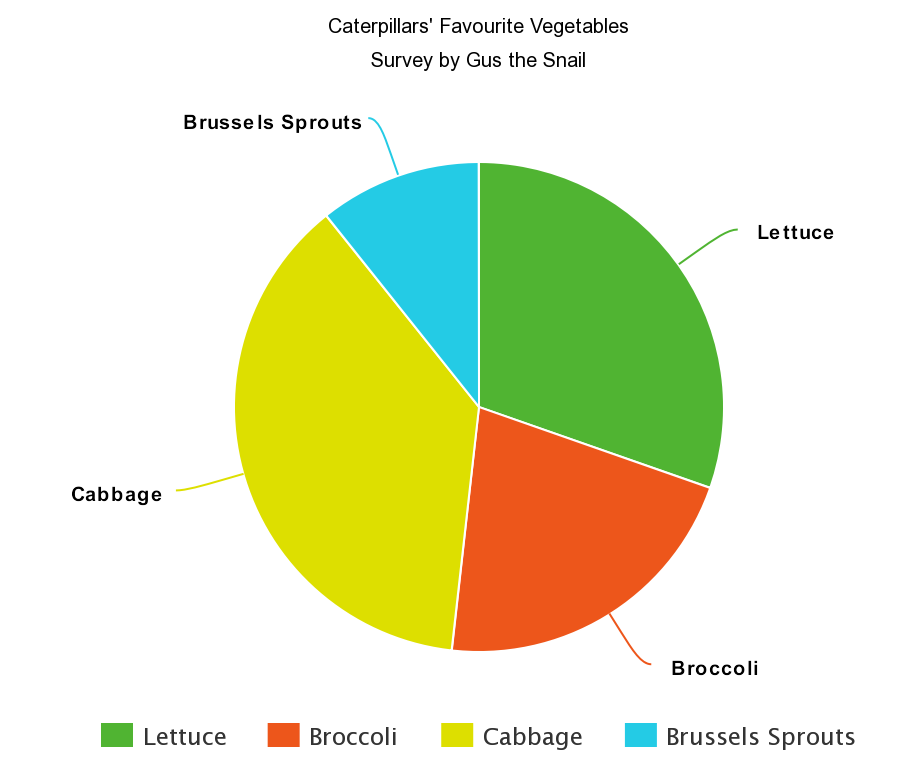
Now Gus can quickly look at his pie chart and see that Cabbage is attached to the biggest wedge, so it's the most popular vegetable with the caterpillars. What's that, Gus? Brussels Sprouts have the smallest wedge, so they're still the least popular? Of course, Gus, we didn't change the data, we only changed the way we displayed it. So, drawing a pie chart using the same data as we used for the bar chart isn't going to change the fact that the caterpillars like brussels sprouts least. The two charts will show the same thing, just in different ways.
Pictographs
A fun way to display data is using a pictograph. In a pictograph, a picture is used to represent a certain number of things. A key at the bottom of a pictograph tells you what each picture, or part picture, stands for. Pictographs aren't very accurate, but they can give you an idea about the relative popularity of different categories, just like bar charts and pie charts.
Here's a pictograph for Gus' caterpillar vegetable survey:
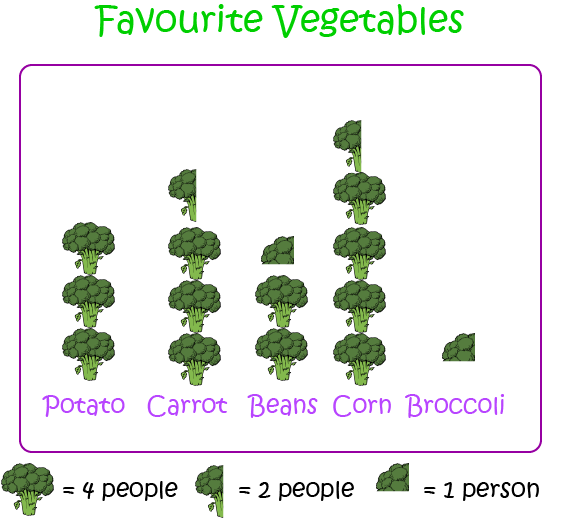
Again, Gus can quickly see that cabbage is the most popular vegetable with the caterpillars, and that russels sprouts are the least popular. As with all the other charts, he can also easily see that lettuce is the second most popular vegetable and broccoli is the third most popular vegetable.
There's one other way of displaying data graphically that we should look at, and that's a line graph. Line graphs aren't really suitable for Gus' data. They're useful when you want to see whether something is increasing or decreasing with time. For example, you might want to find out whether you're getting quicker at running \(100 \text{ m}\), or whether your grades in maths are getting better.
Line Graphs
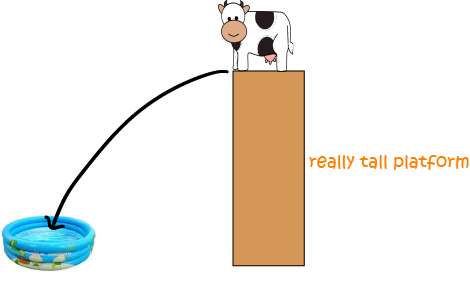
Alice the cow is practising her circus tricks again. This one is a particularly dangerous trick. Alice has to jump off a very high platform and land in an inflatable pool. It's a long way down, and Alice isn't the most dainty of animals. Alice wants to know whether she's getting better at landing in the pool, so she keeps track of the numbers of times she lands in the pool each day for five days. She obtains the data shown in the table below.
| Day | Number of Successful Attempts |
|---|---|
| Monday | \(1\) |
| Tuesday | \(3\) |
| Wednesday | \(3\) |
| Thursday | \(7\) |
| Friday | \(10\) |
So that she can easily see whether her number of successful attempts is increasing, decreasing or staying the same, Alice decides to plot her data on a line graph. Here's Alice's graph:
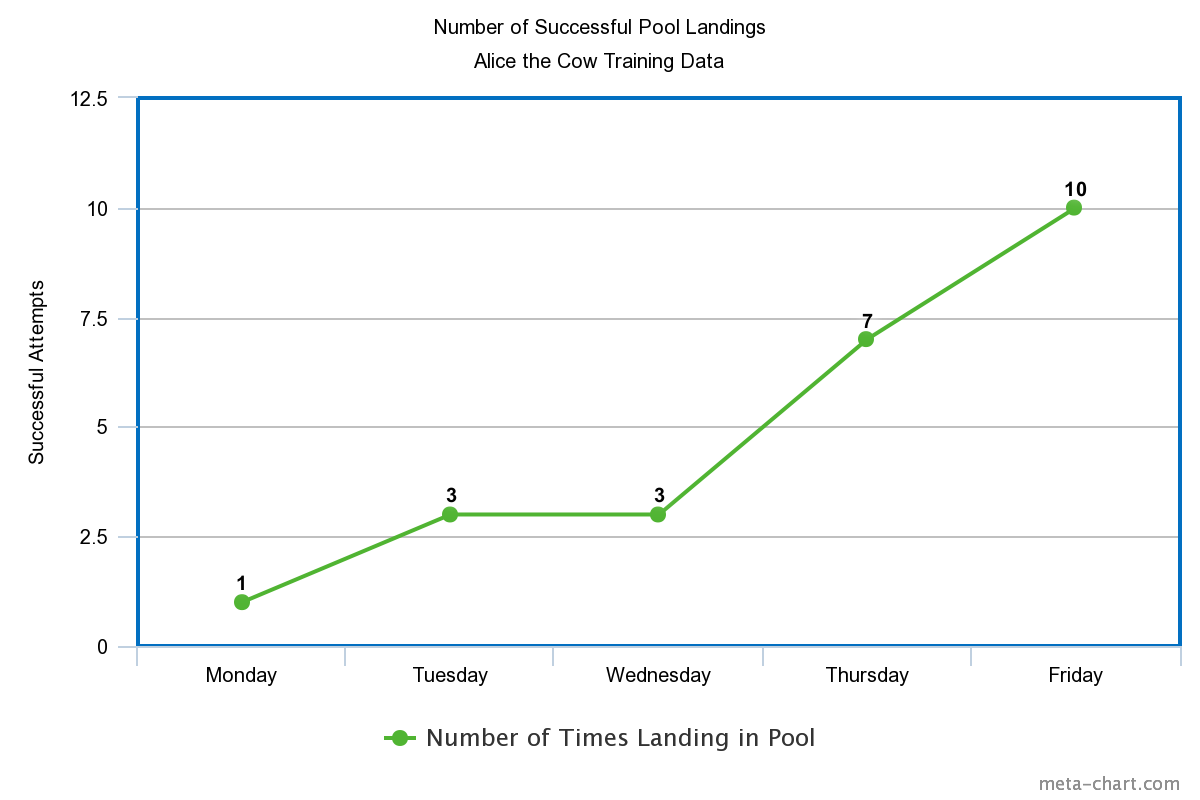
Well, assuming that Alice makes the same number of attempts at doing the jump each day, she is definitely improving. The graph slopes upward as the days move to the right. It would be very worrying if it sloped downward! I'm starting to feel a little better about Alice and this circus trick.
Conclusion
As we've seen, there are a number of different types of graphs you can use to display your data. The choice you make depends on the type of data you have, and what you want to get out of it.
If you're interested in comparing the sizes of classes of data, bar charts and pie charts are a good option. If you're not particularly concerned about accuracy, a pictograph is a fun way of displaying data that also makes comparisons easy.
However, if you want to identify trends in your data (is something increasing, decreasing or staying the same?), a line graph may be your best option.
Description
This mini book covers the core of Math for Foundation, Grade 1 and Grade 2 mathematics including
- Numbers
- Addition
- Subtraction
- Division
- Algebra
- Geometry
- Data
- Estimation
- Probability/Chance
- Measurement
- Time
- Money
- and much more
This material is provided free of cost for Parent looking for some tricks for their Prekinder, Kinder, Prep, Year 1 and Year 2 children
Audience
Grade 1/Year 1, Grade 2/Year 2, Prep, Foundation, Kinder and Pre-Kinder
Learning Objectives
These lessons are for kids aged 4-8 with the core objective to expose their brains to concepts of addition, subtraction, division, algebra and much more.
Author: Subject Coach
Added on: 6th Apr 2018
You must be logged in as Student to ask a Question.
None just yet!