Math Definitions - Letter S
Chapters
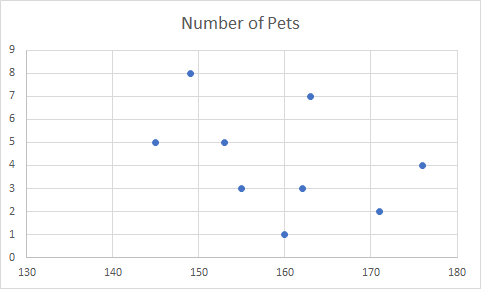
Scatter Plot
Definition of Scatter Plot
A scatter plot is a graphical way of representing the relationship between two sets of data.
For example, the scatter plot in the picture provides a way of comparing the number of pets owned by people with their height.
Each dot represents one person's height and number of pets.
Description
The aim of this dictionary is to provide definitions to common mathematical terms. Students learn a new math skill every week at school, sometimes just before they start a new skill, if they want to look at what a specific term means, this is where this dictionary will become handy and a go-to guide for a student.
Audience
Year 1 to Year 12 students
Learning Objectives
Learn common math terms starting with letter S
Author: Subject Coach
Added on: 5th Feb 2018
You must be logged in as Student to ask a Question.
None just yet!