Year 10+ Coordinate Geometry
Chapters
Exploring the Graph of a Quadratic Equation
Exploring the Graph of a Quadratic Equation
In this article, we are going to map the untamed wilderness of the \(xy\)-plane. The animal we are going to observe is a very important one - the quadratic equation:
Our journey is going to take us on a wild ride through many quadratic equations. The first thing we're going to explore is what happens when we change the value of \(a\).
Changing the Value of \(a\)
First With \(b = c = 0\)
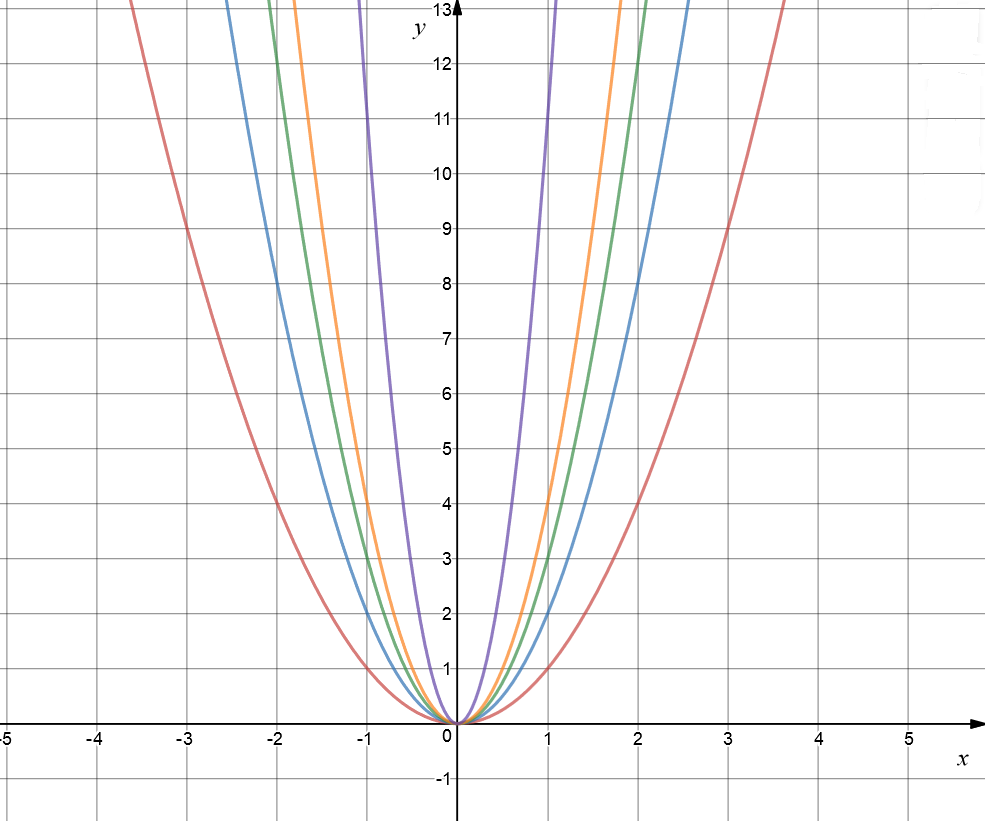
Let's see what happens to graph if we set \(b = c = 0\), and \(a\) to different positive values. In the picture, the red graph shows \(y = x^2\), the blue graph is \(y = 2x^2\), the green graph is \(y = 3x^2\), and the orange graph is \(y = 4x^2\). I went all out for the purple graph: it is \(y = 11x^2\). Do you notice how, as we increase the value of \(a\), the graph gets steeper and narrower?
Now Let's Break All the Rules and Set \(a = 0\)
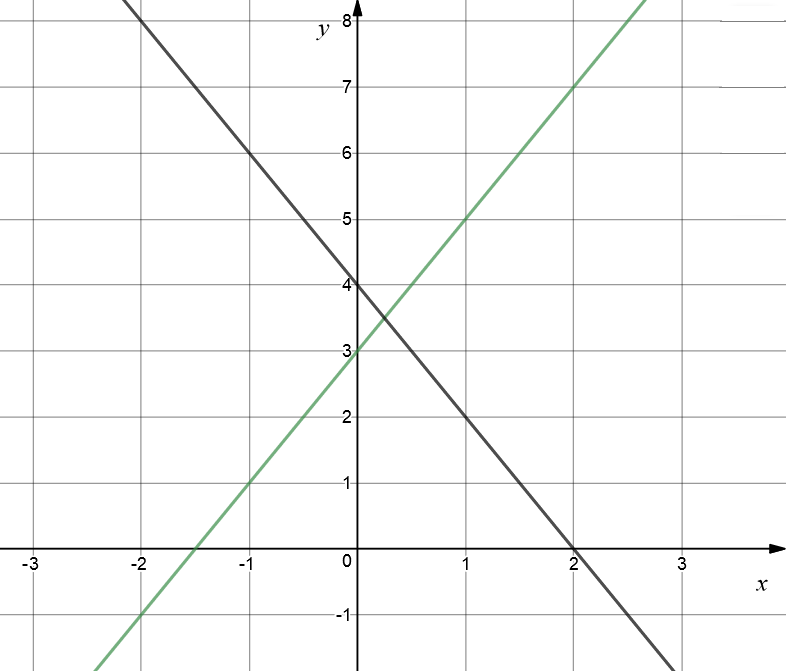
As advertised, we get a straight line. In this picture, the green graph is \(y = 2x + 3\), and the black graph is \(y = -2x + 4\).
Everything's Topsy-Turvy with Negative Values of \(a\)
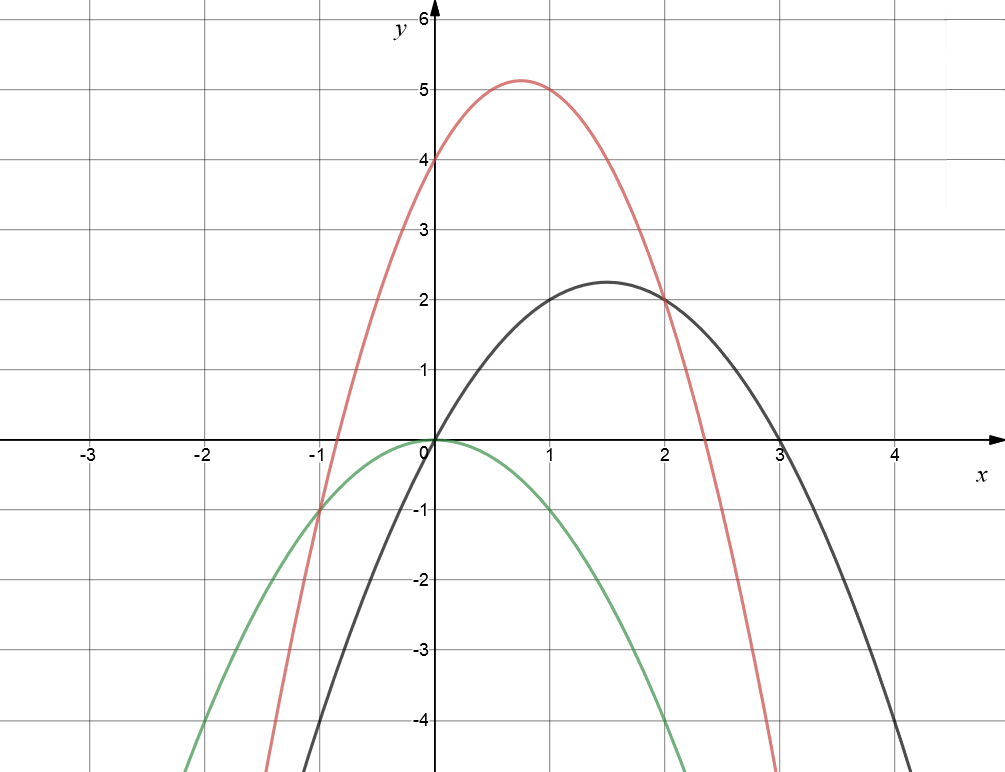
Hold onto your hats! We're turning everything upside down. The red graph is \(y = -2x^2 + 3x + 4\), the black graph is \(y = -x^2 + 3x\), and the green graph is \(y = -x^2\).
Now Let's Change \(b\)
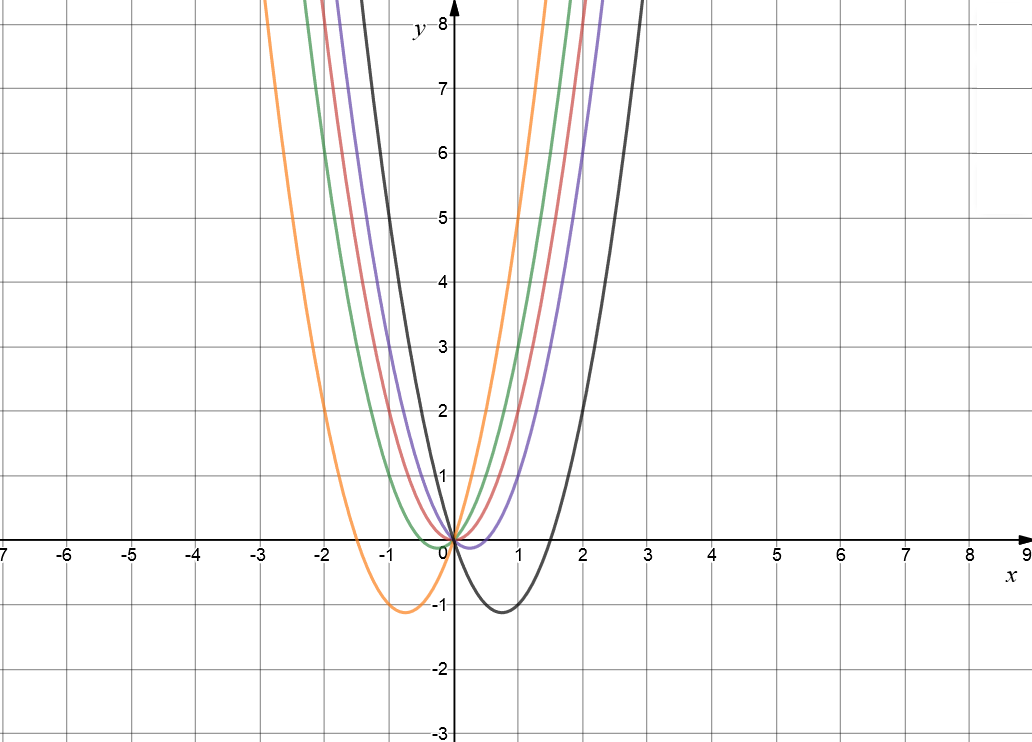
We're going to fix \(a = 2\) for now, and set \(c = 0\), so that we can isolate the effect of changing the value of \(b\) in our equation. The red graph is \(y = 2x^2\), the green graph is \(y = 2x^2 + x\), the orange graph is \(y = 2x^2 + 3x\), the purple graph is \(y = 2x^2 - x\), and the black graph is \(y = 2x^2 - 3x\). Increasing the value of \(b\) shifts the graph to the right and down. The graph shifts to the left and down for larger negative values of \(b\).
Playing With \(c\)
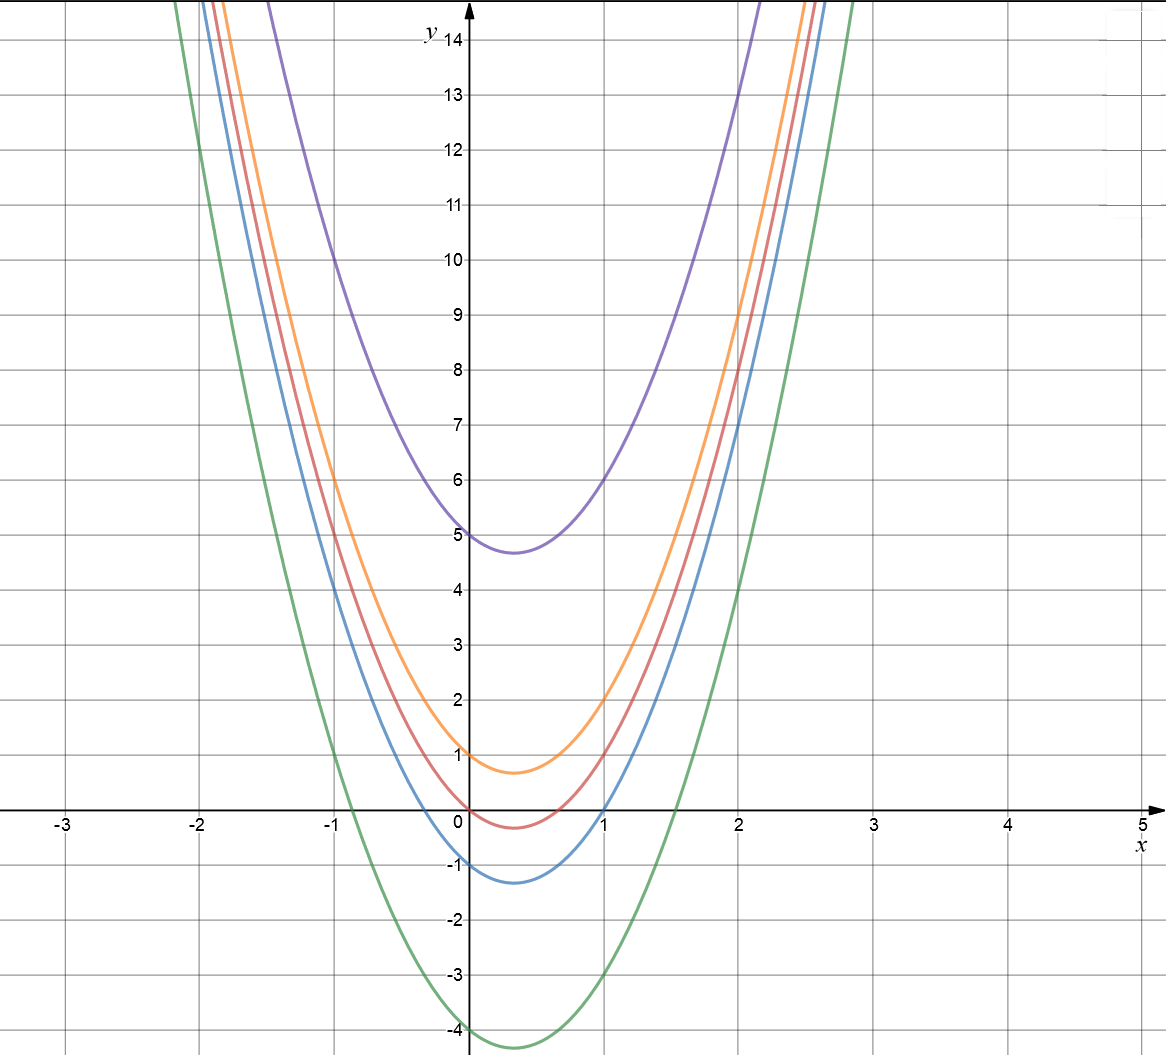
Changing the value of \(c\), while keeping \(a\) and \(b\) fixed shifts the graph up (for positive values of \(c\)) and down (for negative values of \(c\)) the \(xy\)-plane. Here we have the graphs of \(y = 3x^2 - 2x\) in red, \(y = 3x^2 - 2x - 1\) in blue, \(y = 3x^2 - 2x - 4\) in green and \(y = 3x^2 - 2x + 1\) in orange.
Roots of Quadratic Equations
The position of the graph of a quadratic equation in the \(xy\)-plane tells you the number of roots (solutions) of the equation \(ax^2 + bx + c = 0\). If it just tips the \(x\)-axis, the equation has one real root. If it cuts through the \(x\)-axis twice, there are two real roots, and if it avoids the \(x\)-axis like the plague, it has no real roots. Those of you who have seen some complex numbers might be screaming out that every quadratic equation has roots, but they don't all have real roots. Let's see what these graphs look like.
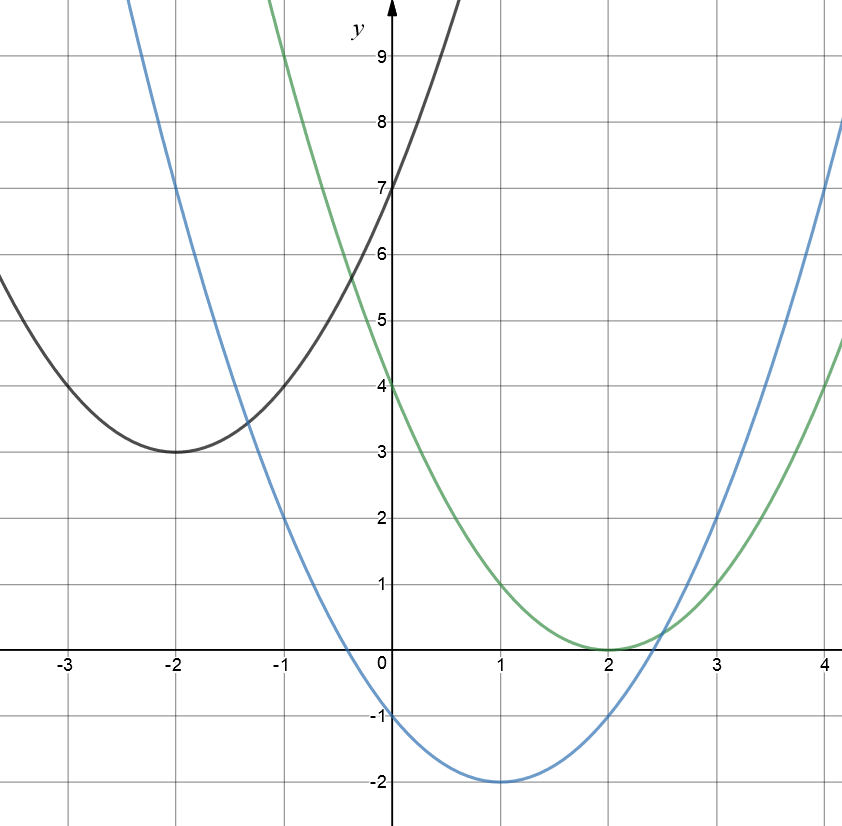
The green graph is the graph of the equation \(y = x^2 - 4x + 4\). It has equal real roots at \(x = 2\). The black graph is the graph of the equation \(y = x^2 + 4x + 7\). It goes nowhere near the \(x\)-axis. The corresponding quadratic equation has no real roots. Finally, the blue graph is the graph of \(y = x^2 - 2x - 1\). As it cuts the \(x\)-axis twice, the corresponding quadratic equation has \(2\) distinct real roots.
Why not have a play around with some more quadratic equations, yourself, using an on-line graphing calculator? Have fun!
Description
A coordinate geometry is a branch of geometry where the position of the points on the plane is defined with the help of an ordered pair of numbers also known as coordinates. In this tutorial series, you will learn about vast range of topics such as Cartesian Coordinates, Midpoint of a Line Segment etc
Audience
year 10 or higher, several chapters suitable for Year 8+ students.
Learning Objectives
Explore topics related to Coordinates Geometry
Author: Subject Coach
Added on: 27th Sep 2018
You must be logged in as Student to ask a Question.
None just yet!