Data
Chapters
Univariate and Bivariate Data
Univariate and Bivariate Data
Data sets can examine different numbers of variables. Univariate data is data related to a single variable. Bivariate data is data related to two variables.
Univariate Data
Some examples of data that involves only a single variable are

If I record the numbers of petals on the flowers in my garden, I might get a list of data like \(5,5,6,4,18,24,16,4,5,5,6,6,7,8\). This data involves a single variable, which is the number of petals. There is no way of looking at causes or relationships with this data. The purpose is simply to describe the different numbers of petals that occur in my garden.

I might want to know what the average weight of a duckling is. To find this out, I could (not really a good idea - you might have to deal with a very angry mother duck) go down to my local lake and weigh all the ducklings that I see there. I could record their weights, giving the results:
What Can You Do with Univariate Data?
We can analyse univariate data in ways that help us to describe our data set. This can include:
- Exploring central values of the data using measures such as the mean (average), median (middle value) and mode (most common value).
- Examining the spread of the data using measures such as the maximum and minimum values, range, variance, standard deviation and interquartile range.
- Plot the data on bar charts, pie charts or histograms. Note that these all plot the frequencies of the values of a single variable.
A question you might seek to answer with univariate data is "How many of the flowers in my garden have more than 6 petals?"
Bivariate Data
Bivariate data has two variables. To form bivariate data, we collect two different types of data. We collect bivariate data when we want to examine the relationships between things, or to decide whether one variable may have caused the other.
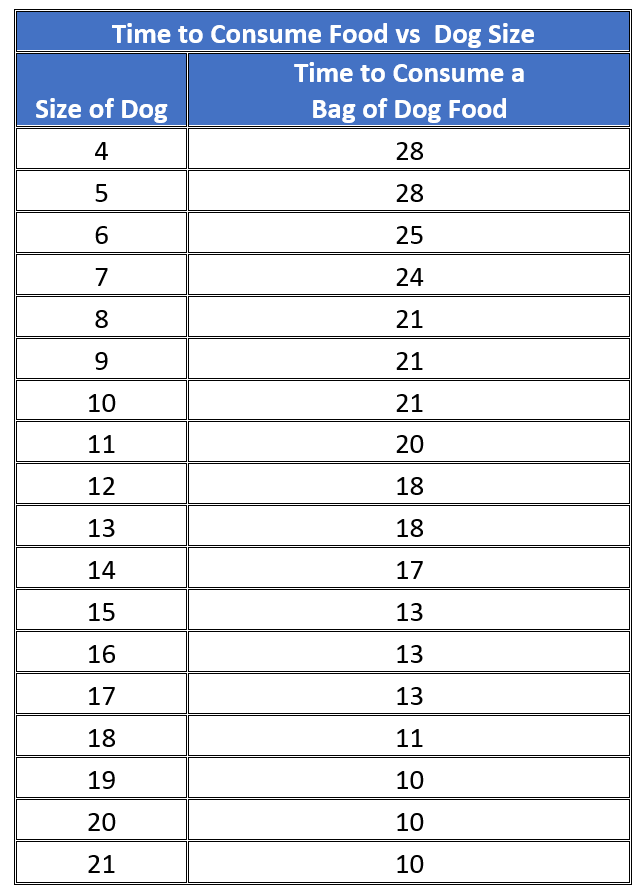
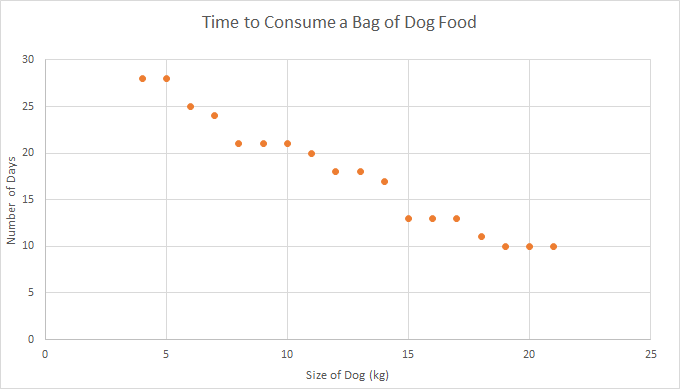
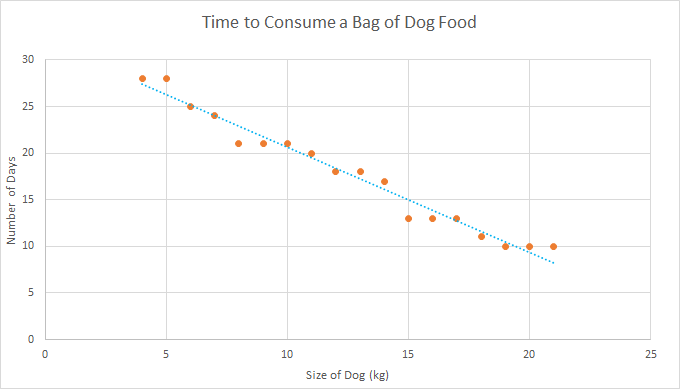
Example: Pet Food

This is my little puppy Lucy. She likes to snuggle in between the cushions on the lounge. Lucy eats dry dog biscuits for her dinner. I've been wondering whether we'll go through the dog biscuits more quickly as she gets bigger, so I have decided to investigate the relationship between the sizes of dogs and the rate at which they go through bags of dog food. I need to collect data values for two variables: time to consume dog food, and weights of dogs. In other words, I need to collect bivariate data.
Here is the data that I've collected so far:
So, in summary, we use bivariate data when we want to examine the relationships between two variables, or the causes for things.
Using Bivariate Data
We analyse bivariate data to help us explain these relationships. Our analysis might include:
- Comparing the central measures and spread of the two variables when considered individually: mean, median and mode, maximum, minimum, range, variance, standard deviation, interquartile range, etc.
- Looking for correlations between the data.
- Looking for relationships, causes and explanations.
- Drawing up side by side tables of the two variables to lay the data out for comparison.
- Identifying independent and dependent variables.
- Drawing scatter plots and line graphs, and plotting lines of best fit.
A question you might seek to answer using bivariate data would be, "Is there a relationship between the size of a flower and the number of petals it has?"
Description
This chapter series is on Data and is suitable for Year 10 or higher students, topics include
- Accuracy and Precision
- Calculating Means From Frequency Tables
- Correlation
- Cumulative Tables and Graphs
- Discrete and Continuous Data
- Finding the Mean
- Finding the Median
- FindingtheMode
- Formulas for Standard Deviation
- Grouped Frequency Distribution
- Normal Distribution
- Outliers
- Quartiles
- Quincunx
- Quincunx Explained
- Range (Statistics)
- Skewed Data
- Standard Deviation and Variance
- Standard Normal Table
- Univariate and Bivariate Data
- What is Data
Audience
Year 10 or higher students, some chapters suitable for students in Year 8 or higher
Learning Objectives
Learn about topics related to "Data"
Author: Subject Coach
Added on: 28th Sep 2018
You must be logged in as Student to ask a Question.
None just yet!