Data
Chapters
Grouped Frequency Distributions
Grouped Frequency Distributions
Frequency
The frequency of an event is how often it occurs.
Example
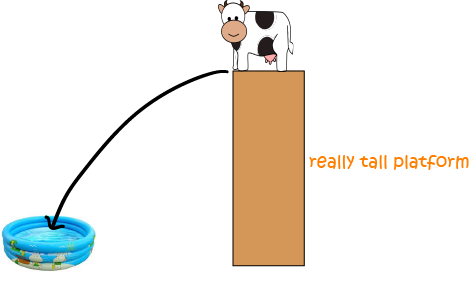
Alice the cow is up to her dare-devil circus tricks again. This time she's learning to jump of a really high platform, with the hope of landing in an inflatable kiddy-pool. As you can imagine, she doesn't manage to land in the pool every often.
She lands in the pool
- Twice on Monday
- Once on Tuesday
- Three times on Wednesday and
- Five times on Thursday
Frequency Distribution Table
We can count how many times each score occurs in a list of data and collect them together in a frequency distribution table.
Example
Sam's maths teacher gives his class a weekly pre-test to see how well they understand the background material required for the next topic. Here are Sam's marks on the tests for the first 12 weeks of the year:
| Test Mark | Frequency |
|---|---|
| 12 | 1 |
| 13 | 0 |
| 14 | 1 |
| 15 | 0 |
| 16 | 2 |
| 17 | 4 |
| 18 | 2 |
| 19 | 0 |
| 20 | 2 |
We can also group Sam's marks into different ranges. In the table below, each range is a group of 3 marks. The frequency is the sum of the frequencies for the marks in each range.
| Mark Range | Frequency |
|---|---|
| 12-14 | 2 |
| 15-17 | 6 |
| 18-20 | 4 |
Grouped Frequency Distributions
The example above showed one way of grouping frequencies. When a data set contains a lot of different values, many of which don't occur very often, it's very useful to group the data values into different classes (or groups). This makes it easier to interpret your data and identify the most common ranges of values, and other trends. Let's work through another example in detail.
Example: The World's Most Boring Book
Sam's English teacher has selected the world's most boring book for her class to read. Even the title is so boring that I won't mention it: it would bore you to tears. Sam has tried really hard to read this book, but just can't get further than page 30. He decides to survey his class-mates to find out just how many pages everyone has managed to struggle through. The book has 1,757 pages. Here is a list of the data he has collected:
As you can see, there are many different values, and not many repeated values. He decides that the only way to draw some sensible conclusions from this data is to construct a grouped frequency distribution table.
His first step is to sort the data into increasing order:
Next, he needs to find the range of his data, which is equal to the highest value minus the lowest value:
- The highest value (the maximum) is 97
- The lowest value (the minimum) is 2
- So, the range is \(97 - 2 = 95\)
Finding the Group Size
Now he needs to calculate an approximate size for his groups. First he decides how many groups he would like, and then he divides the range by that number.
Sam decides that he would like to have 10 groups, so this gives him an approximate group size of \(95 \div 10 = 9.5\).
If you're dealing with data that is measured in whole numbers, try to have your group size equal to a whole number, so round this up to the next integer.
Sam's group size will be 10.
If your data isn't measured in whole numbers, round your group size up to the nearest simple value that makes sense for your data.
Pick Starting and Ending Values for Each Group
Your starting value should be less than or equal to your smallest value. It's a good idea to make it a multiple of the group size if you can.
Sam's smallest value is 2, so he's decided that 0 is a good place to start. Each group has size 10, so the groups that make sense for Sam are:
- 0-9
- 10-19
- 20-29
- 30-39
- 40-49
- 50-59
- 60-69
- 70-79
- 80-89
- 90-99
Note: Don't go too far when you're listing your groups, but do make sure your last group includes your largest value.
If you don't like the look of your groups when you've finished with this step, you can always go back and change your starting value, and group size, and have another go.
Upper and Lower Values for Each Group
This doesn't really matter for Sam's data because it is discrete (it can only take on integer values).
If you have continuous data, like the heights of students, or the lengths of lizards, you'll need to decide on how you're going to group your decimal places. For example, if you use classes of 0-5 cm and 6-10 cm, you could decide to include all lengths between 0 and 5.5 cm in the 0-5 cm class and all lengths from just over 5.5 cm up to 10.5 cm in the 6-10 cm class.
Tally Your Results and Fill in Your Table
Finally, you need to tally your results to find your frequencies. It's a good idea to include a total on your table as well. Here's the completed grouped frequency table for Sam's boring book example:
| Page Range | Frequency |
|---|---|
| 0-9 | 2 |
| 10-19 | 6 |
| 20-29 | 3 |
| 30-39 | 5 |
| 40-49 | 4 |
| 50-59 | 3 |
| 60-69 | 1 |
| 70-79 | 0 |
| 80-89 | 0 |
| 90-99 | 1 |
| Total | 25 |
It looks like most of the class have read somewhere between 10 and 59 pages, so Sam isn't doing too badly. I wonder if that student who said he or she had read 97 pages was telling the truth. Maybe he or she was just trying to make Sam feel bad.
Display Your Data
You might like to display your data using a bar chart (if it's discrete) or a histogram (if it's continuous). Have fun!
Description
This chapter series is on Data and is suitable for Year 10 or higher students, topics include
- Accuracy and Precision
- Calculating Means From Frequency Tables
- Correlation
- Cumulative Tables and Graphs
- Discrete and Continuous Data
- Finding the Mean
- Finding the Median
- FindingtheMode
- Formulas for Standard Deviation
- Grouped Frequency Distribution
- Normal Distribution
- Outliers
- Quartiles
- Quincunx
- Quincunx Explained
- Range (Statistics)
- Skewed Data
- Standard Deviation and Variance
- Standard Normal Table
- Univariate and Bivariate Data
- What is Data
Audience
Year 10 or higher students, some chapters suitable for students in Year 8 or higher
Learning Objectives
Learn about topics related to "Data"
Author: Subject Coach
Added on: 28th Sep 2018
You must be logged in as Student to ask a Question.
None just yet!