Getting started with Selenium
Chapters
Selenium IDE: An integrated development environment for Selenium
Selenium scripts are generated by using Selenium IDE. It is a part of Firefox extension and allows recording, debugging and editing tests.
Selenium-IDE Download:
Follow the below steps to download the Selenium IDE:
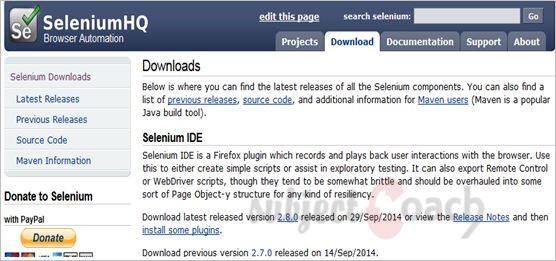
Step 1: Go to the following URL: http://seleniumhq.org/download/.
Under the Selenium IDE section, click on the link that shows the current version number as shown below.
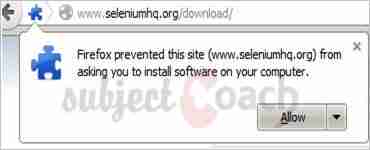
Step 2: Firefox add-ons notify pops up with allow and disallow options. Click on “Allow”,
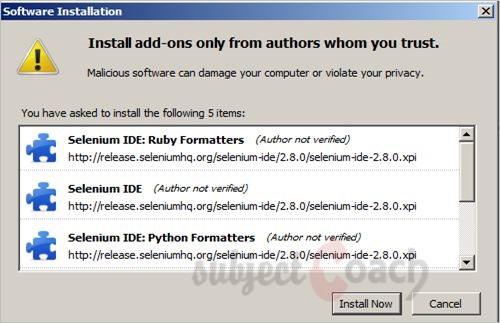
Step 3: Click 'Install Now'.
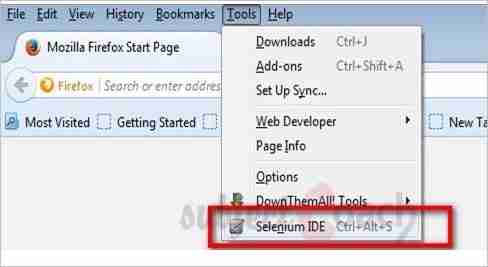
Step 4: The Selenium IDE can now be accessed by: Go to Tools click “Selenium IDE” as shown:
Step 5: It can also be accessed directly from the quick access menu bar as shown below.
Selenium - IDE Tool Features:
The features of Selenium IDE as shown below:
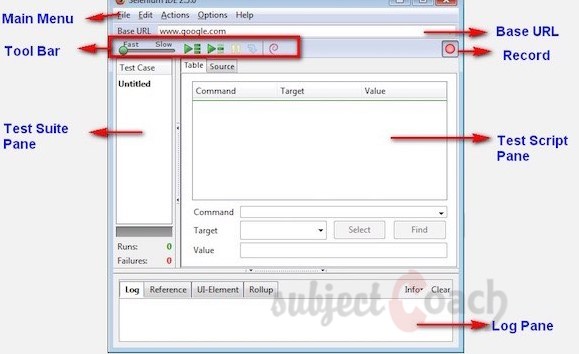
The features of the tool bar are explained below.
![]()
|
|
Playback Speed: which is used controls the speed of Test Script Execution. |
|
|
Record: Used to starts/ends your recording session. |
|
|
Play entire test suite: This is used to play all test cases listed in Test Case Pane sequentially. |
|
|
Play current test case: This is used play only the currently selected test case in the Test Case Pane. |
|
|
Pause/Resume: This is used to pause or resume playback. |
|
|
Step. This button used to allow stepping into each command in test script. |
|
|
Apply rollup rules: It allows grouping selenes commands and executing them as a batch/single action. |
IDE Test Creation:
The all script creation process can be classified as below:
- Recording and adding commands in a test: Selenium IDE allows the user to record user interactions and thus the recorded actions as a whole are named as Selenium IDE script.
- Saving the recorded test: After recording a stable script, tester may want to save it for future runs and regressions.
- Executing the recorded test: Here the recorded scripts are executed.
- Saving the test suite: A test suite is a collection of tests scripts that can be executed as a batch/single entity.
Recording and Adding Commands in a Test:
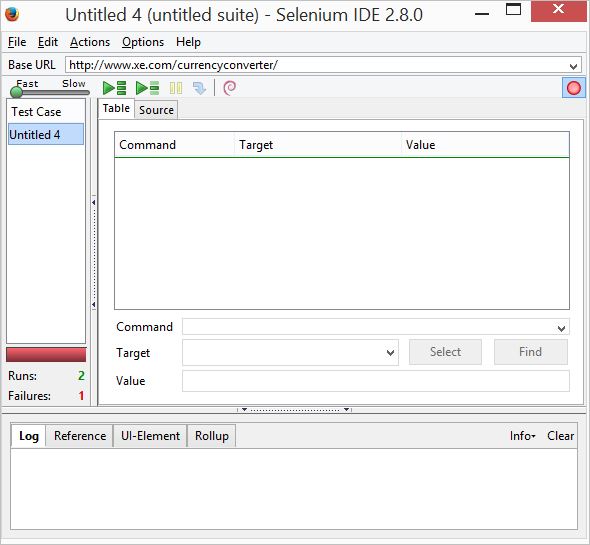
Launch the Firefox browser and go to - http://www.xe.com/currencyconverter/
Step 1: Open Selenium IDE and click on record button as shown below.
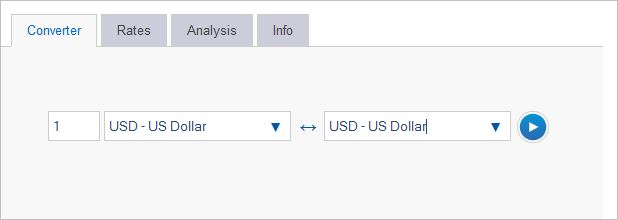
Step 2. Choose USD to USD converion as shown below
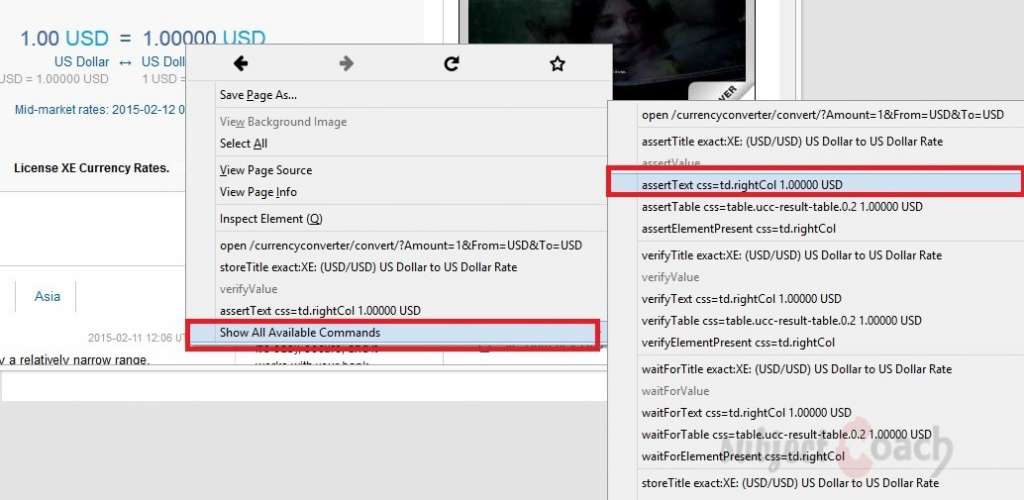
Step 3: Now click on that blue button to launch conversion, this will take you to another page that shows conversion result. Now right click on the final converted value element and you will see a menu with option Show All Available Commands, here you can choose one of the few available options, choose the assert option that is shown below. We are matching this table data element with value 1.00000 USD
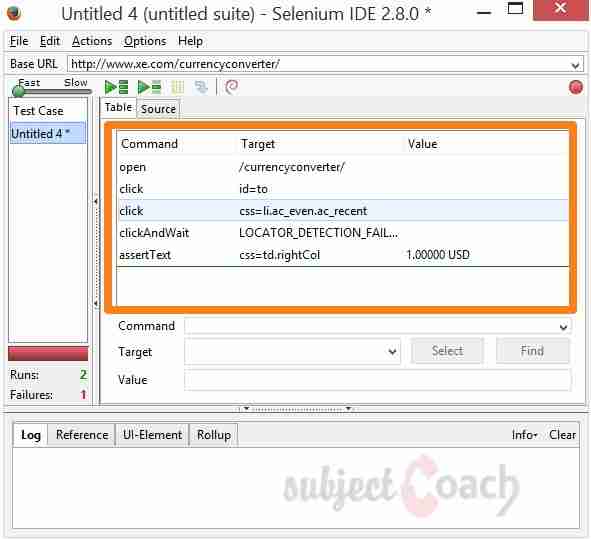
Step 4: The recorded and generated script is displayed as shown below
Saving the Recorded Test:
To save the Test Case: click on "File" select "Save Test" and save the file in the location of choice.
By default the file is saved as .HTML,it can also support to be saved with an extension htm, shtml, and xhtml.
Saving the Test Suite
A test suite is a collection of number of tests that can be executed as a batch.
Step 1: Create a test suite: Go to "File" select "New Test Suite".
Step 2: The tests can be recorded choosing the option "New Test Case" from the "File" Menu.
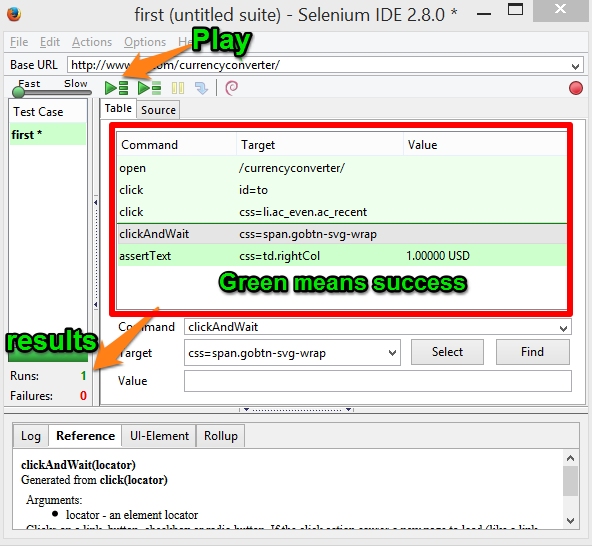
Executing the Recorded Test:
Two methods to execute the Recorded Test:
- By clicking "Play entire suite"
- By clicking "Play current test".
- Step 1: After execution of a step, the user can get the result in the "Log" Pane.
- Step 2: The status pane shows the Run status which displays the number of tests passed and failed.
- Step 3: If the background of the test step turns "Green" if passed and "Red" if failed as shown.
Selenium-IDE Debugging:
Debugging is a process of identifying and reducing the number of bugs/defects/errors.
Here, we can make use a plugin "Power Debugger" for Selenium IDE, to make the process more robust.
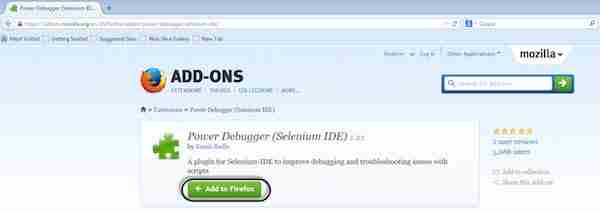
- To install Power Debugger for Selenium IDE: Follow the URL https://addons.mozilla.org/en-US/firefox/addon/power-debugger-selenium-ide/ and click "Add to Firefox".
- Open 'Selenium IDE' and there is an extra button visible in the toolbar of selenium IDE after installing the plugin. We can see the button in the following screenshot. Using the below options users can "pause on fail" to on or off any time, when the test is running also.

Pause and Break:
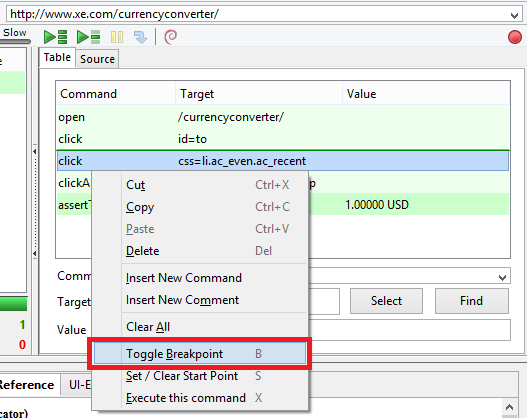
To pause the test at any time, click the Pause icon in the toolbar or by using breakpoints. To set a breakpoint: right-clicking on a command where we want Selenium IDE to pause before start execution, and select ‘Toggle Breakpoint’ from the context-menu.
- "Right Click" and select "Toggle Breakpoint" from the context-sensitive menu to add a breakpoint on a step.
-
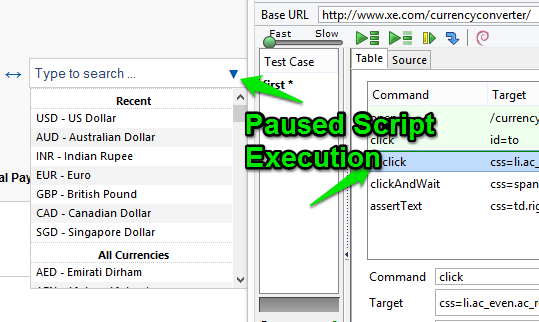
After successful insertion of the breakpoint, the particular step is displayed with a pause icon.

- Once the script execution process starts, execution is paused where the breakpoint is added.
In next chapter we will learn about setting up environment for selenium.
Description
This tutorial will get you started with Selenium. This tutorial is subdivided into 11 chapters.
- Overview
- IDE
- Environment Setup
- Remote Control
- Selenese Commands
- Webdriver
- Locators
- User Interactions
- Test design techniques
- TestNG
- Grid
* freelancer contributed
Environment
A PC capable of running selenium
Prerequisites
A basic idea of what Software Testing is.
Audience
People who wish to get started with Selenium
Learning Objectives
You will learn ins and outs of Selenium which includes downloading, installing and using Selenium.
Author: Subject Coach
Added on: 10th Feb 2015
You must be logged in as Student to ask a Question.
None just yet!